What makes uv slow?
A lot has been said about uv being fast, but not about how and when uv is slow. Let's talk about both.
The paragraphs are in no particular order, except the first two (overview and benchmarks) and the last one (tooling).
Overview
We get a lot of questions if there's some sort of hidden magic, if there are shortcuts we're taking, but in practice it's trying optimizations that worked well for others as well as a loop of profile, poke at the code, benchmark, PR, repeat.
If you're mainly interested in the resolver algorithm, head over to the uv internals docs, the pubgrub introduction and the pubgrub-rs guide. They cover the subject in-depth, i'll only touch briefly on them here.
In general, what's slow is always roughly the same, from high-level to low-level:
- Invoking external (build) tools
- Network requests
- cpu heavy code, such as (de)compression, hashing, parsing and constraint solving
- Disk reads and writes
- Singlethreaded and synchronous code
- Allocating, memory copies and syscalls
Optimizations happen roughly in that order: For example, transition from source distributions to wheels removed the need to invoke build tools each time, then caching wheels reduced network IO massively, an unzipped cache built reduced the decompression burden, reflinking/hardlinking turns file read/writes into link read/writes. Each of those is sped up proportionally by multithreading and IO concurrency, while avoiding allocations, memoization, faster hashmaps and similar local optimizations remove remaining bottlenecks throughout. uv uses existing heavily optimized implementations of staple cpu-heavy algorithms ((de)compression, hashing, http parsing, etc.)1; classic "Big O" optimizations are rare. The one exception is pubgrub, which exists as a library outside uv.
Benchmarks
Throughout this article, i'm using three main benchmarks: airflow, boto3 and homeassistant.
Apache airflow is a massive workspace with 126 apache-* packages and 892 total packages in a resolved workspace. Resolving its dependencies requires some backtracking and includes some source distributions. It's useful as the biggest real example that's freely available.
boto3 is the official interface for AWS. It's one of the most downloaded python packages, and creates a new release every time AWS changes. boto3 depends on botocore, which depends on a recent urllib3 version. When resolving with an old urllib3 version, such as urllib3<1.25.4 boto3, the resolver needs to do a lot of backtracking through boto3 and botocore versions, to find a boto3 version that depends on a botocore version that is compatible with urllib3<1.25.4. This is something that happens to users when they depend on one package that can use data stored on S3 and another one that requires a specific urllib3 range, so we adopted it as backtracking and parallel networking benchmark2.
Homeassistant is a home automation platform that can connect to about every smart home there is. Supporting all those diverse protocols requires a large number of dependencies, and install performance matters a lot. Despite the large number of dependencies, it's not particularly interesting as a resolution, the dependency tree is rather flat and heavily constrained.
If you have cases that are particularly slow except for source distributions, please let me know!
To give you a sense of the numbers, let's compare a linux desktop (fiber), a raspberry pi 4B (fiber) and a windows laptop (wifi).
A cold cache uv sync in airflow takes 54s on my desktop and 10.5min on the raspberry pi. It's dominated by building two large packages, art of that are two parallel builds (krb5 and gssapi) that take 44s and 22s respectively, the bottleneck for the whole process. The same operation on the raspberry pi takes 10.5 min. After the installation, uv run python -V takes 171ms on my desktop and 1.1s on the raspberry pi.
Plotly is ideal as small installation speed benchmark: It's a popular package with a lot of files, but only two dependencies, all three with platform-independent builds. Installing plotly with a cold cache takes 310ms on the desktop, 2.3s on the raspberry pi and 4.8s on the windows laptop. With a warm cache, we get to skip the first phase with network requests and the download, and it goes down to 40ms for the dektop, 120ms on the raspberry pi and 900ms on the windows laptop. Windows is slow due NTFS, on a ReFS dev drive it takes only 450ms. 3
Toml parsing
Toml is a file format that's easy to write, doesn't have a lot of complexity and is compatible with a lot of json tooling such as jsonschema. uv chose toml for uv.lock (just like poetry.lock and pylock.toml) for being user readable, and more importantly, generating good diffs when updating dependencies. Those are important for auditing dependency changes, such as through dependabot or renovate. 4
While json parsers can do 1GB/s parsing on a 10 year old laptop, rust's toml parser unfortunately is slow 5. For a large project such as apache airflow6, it takes uv ~30ms just to read the lockfile. For comparison, print("hello world :3") is 10-15ms7.

Figure: uv run python -V in a airflow fully installed airflow checkout. The x-axis is time, each blue bar represents a span of the kind on left running. In this case, the top bar is parsing uv.lock, while the many small bars are parsing the workspace member pyproject.toml files to decide whether the lock needs to be updates (satisfies). Click the image for a (large) svg with interactive tooltips showing the path for each parsed file.
Obviously, you should also avoid parsing pyproject.toml 131 times.
But even if you parse every pyproject.toml only once, large workspaces such as airflow have an overhead: uv run needs to check whether the lockfile is fresh or whether we need to resolve and install change dependencies, and that needs to look at each local package and parse its pyproject.toml. Non-local dependencies either have static metadata (registry dependencies), are only updated on demand (git dependencies) or follow refreshing rules (http dependencies). For airflow, it takes ~20ms just to check whether the lockfile is satisfied, almost entirely for workspace member parsing (the "satisfies" bar in the plot above).
For registry, git and http (link to a file) dependencies, uv stores the metadata for registry dependencies in a zero-copy format. With rkyv it only needs to do the minimal validations against undefined behavior and pointer rewriting, the data on disk is in the same format as the in-memory representation, no parsing involved. Loading those is fast (though not entirely memory efficient at the moment) in cases in which uv does need to resolve, and not only to validate.
Version representation
Surprisingly, a big bottleneck is the type used for representing package versions. As the index page for a package gives us all versions of that package, and all clauses in the resolver use versions as literals, we create and copy a lot of versions, so much that with a naive version type, benchmarks are dominated by version operations. This isn't only the case for uv, but also a bottleneck for pip and packaging.
uv uses an optimized version parser and small version representation. The version type is internally an enum (tagged union)8 of a small type for a subset of versions that fits into 8 plus 8 bytes 9 and a large, heap allocated type that can represent any version. The small type can represent notably represent three part versions with components <255 and an optional prerelease. Its bytes are ordered in the same way that versions are and copying it is a 16 byte copy. The large variant supports the full feature set of PEP 440, some of which require separate heap allocations, such as the strings in a local version. In the version enum, the large version is wrapped in an Arc, rust's basic reference counting type, which itself is only a point to the heap allocation of reference count and payload. Copying Arcs is generally fast, it's an atomic number increase, but can become notable at resolver-scale.
Resolutions that include packages with a huge number of releases that don't fit into the small version, such as many too large dev releases, make uv slow. For example, concluding and reporting that tensorflow-io-nightly can't be used with python 3.14 takes 500ms, as this package has a huge number of releases that all have too large dev versions. (Finding a valid solution on python 3.10 takes 40ms.)
Removing the small version optimization makes resolving boto3 2.1x slower (490ms -> 1030ms). Additionally replacing the Arc in the full version with a Box, this becomes 4.7x (490ms -> 2270ms). Notably, removing the Arc optimization without removing the small version has almost no effect: Almost all versions fit into the small variant.
Figure: A performance ablation of uv resolving boto3. The first flamegraph is the optimized version. In the second, the small version type is disabled and the version comparisons become notable. In the third once, the large version doesn't use an Arc anymore on top of the small version being, and version cloning and dropping starts to dominate. Note that they while they have the same width, they represent increasing amounts of time. TODO: Cut to 1% frames
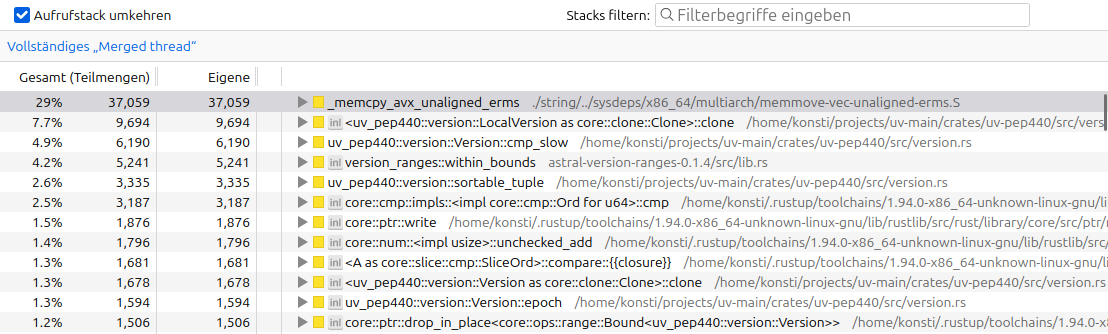
Figure: The samply inverted stack trace of resolving boto3 without the small version optimization in uv's version implementation, uv_pep440. It shows the functions that take the most time on their own (flamegraph leaves), rather than the total time of each.
TODO: EXAMPLES and DATA for the outlier from the ecosystem test
TODO: samply plot from the ecosystem test
Another important packaging type are platform markers, whose arbitrary boolean expressions uv represents with algebraic decision diagrams. Those are technically an SMT solver, parallel to pubgrub being a SAT solver. This is one of the few locations where with a classic algorithms and data structures optimization. The marker representation is canonical, deterministic and allows queries such as whether one marker expression is a subset of another.
Missing wheels and dynamic metadata
Python packages come in two forms, source distributions and (built) wheels. If any wheel exists, uv can use the dependency information from the wheel during resolution, which is always statically encoded 10,11. When there's no wheel, modern source distributions (PEP 643, core metadata v2.2) can specify static dependency information. If they don't, or they use a too old core metadata version, getting this information from a source distribution is a complex process that requires downloading the entire source distribution, setting up a separate venv with an independently resolved set of build dependencies and invoking python hooks. This alone can be slower than an entire resolution with static metadata. If the source distribution requires building native code, it's even slower.
During resolution, uv may have to do this process for several versions of a package as it backtracks through finding a suitable version. During installation, it can use cached builds, but installing on a cold cache system needs to build all missing wheels, which is several times to magnitudes slower than the wheel installation process.
TODO: An example is resolving airflow, ...
Missing index protocols
Another potential reason for it being slow is that the registry12 doesn't implement PEP 658 (Static Distribution Metadata in the Simple Repository API) nor supports http range requests, an old trick that allows reading the metadata file from a wheel without downloading the whole wheel. When both are missing, uv has to download the whole file for each package, and in the bad case that we're backtracking on torch, we download hundreds of megabytes repeatedly.
Compression
Wheels are zip-compressed with default DEFLATE algorithm, while source distributions are gzip compressed tar-archives. DEFLATE (1990) and gzip (1992) both produce larger files and with slower decompression than modern compressions such as zstandard (2015). While uv uses a streaming zip and tar decoder to combine downloading and unzipping into the cache, at least the larger download sizes are notable. The slower decompression may not be noticeable as it's usually still faster than the download itself, but leads to unnecessarily high cpu load.
Hashing
uv needs to check the hashes of all artifacts it downloads, to ensure they haven't been manipulated13. Using SHA-256, this is notably slow. While hashing is by design slow, a different hashing algorithms such as blake3 would be faster. uv currently follows SHA-256 being the ecosystem standard and widely available from registries.
Virtual environments
Installing python packages involves copying all the packages into a directory for each installation. Even if you reflink them (also known as copy-on-write, supported on the default mac filesystem, some linux filesystems and rarely on windows) or hardlink them, and even if you do this with a thread per package, you still have to walk the whole source tree and copy it. There is no fundamental reason why python can't use packages from a centralized store, as other ecosystems do.

Figure: uv pip install transformers[torch] into a fresh venv from a warm cache on linux (hardlinking). Each blue bar in the link step is a package, where the long 70ms bar is installing torch. "solve" is the dependency resolution step, each "link_wheel_files" us installing a package from the cache. The source svg with more details is linked.
TODO: use a uv sync plot, prune it and display the svg
All those packages in the cache are already unpacked and in the correct general shape for python to import, the installation process largely duplicates the existing tree.
uv recently switched to trying reflinking by default on linux, which is faster on the filesystems that support it (many servers and CI machines use ZFS or XFS), unless it's a filesystem where somehow reflinking is slower than hardlinking. There isn't a known way to detect which methods are supported without trying them, nor to know which one is the fastest.
Accepting venvs, uv is comparatively slower to bun building node_modules inside of a package.
Backtracking
uv uses pubgrub for dependency resolution. Checkout this page and the linked pubgrub docs on how uv's solver works - it's too complex to repeat here. The talk uv: an extremely fast package manager also has a great explanation, including some of the algorithmic and implementation optimizations. Pubgrub is responsible when uv is fast during complex backtracking scenarios and also when it gives helpful error messages about failed resolutions14.
In a basic pubgrub implementation, once you choose a package, you try versions from most preferred to least preferred (newest to oldest), only discarding are version if no solution with it is possible. A bad decision early on can lead to trying a lot of versions, only to fail at the same conflict over and over again. uv extends the basic pubgrub algorithm to record which packages are involved in a conflict, and when two packages cause too much backtracking, switch their priorities and manually backtrack before both of them, allowing pubgrub to explore a different part of the solution space. There is a detailed write-up of the problem and the solution. This however doesn't work if the conflict is through an indirection.
uv has to be somewhat conservative when it comes package priorities and heuristics, to ensure the robustness of the solution and to keep churn minimal, e.g. from updating a single package. A faster resolver could always pick packages and versions in the order in which it gets metadata, but that would mean running uv pip compile or uv lock twice with no new version could give different results. Instead, uv prioritizes based constraint wideness and the order of discovery, which is deterministic giving the registry doesn't change (or an exclude newer cutoff is set).
In the case from above, where there's a missing optimization, we ended up not shipping it. This would have been a behavior change in the resolver, and the library that initially motivated the change had solved the problem with better dependency bounds in the meantime. When resolving the top 15k pypi packages by downloads with uv pip compile, the slowest ones take ~160ms on my machine, without particularly strong outliers. How good or bad dependency structures worked in old tools, most notably pip, has shaped what subset of the theoretically SAT-hard space packages actually occupcy. A resolver can be fast by handling those patterns, and while it's easy to craft stress test examples, i'm not aware of any real-world examples where a warm cache uv resolve is notably slow (If you got any, let me know!).
Simple api
The repository api for python packaging evolved from user-facing html pages of code archives to download, which started to get scraped by installers. While there's now a proper json interface, it's still fundamentally a list of filenames. That's kinda slow to parse (TODO: numbers).
More fundamentally, it means that for each version the resolver tries, it needs to do another request to fetch the dependencies of that version. The information a package manager actually needs is small, in most cases it's only the concatenated contents of project.dependencies and project.optional-dependencies, yet we have to pay a separate http roundtrip each time. On top of that, each response is separate in uv's cache, so even with a warm cache we pay extra for loading the metadata for each version.
TODO: perf of parsing a large index page
TODO: In uv's cache we save the responses raw, which is much larger than they'd need to be, which gives uv such a big memory footprint, even through rkyv.
TODO: boto3 pic
Multithreading is hard
Scheduling diverse network, IO and CPU loads is hard. It's not intuitive that you need to put the resolver into its own thread even when it's largely IO bound, the resolver's CPU boundness still makes network IO slower. There's also convenience vs. performance: uv likely isn't faster by using async/await than by using threaded IO, but there's a large async ecosystem and async abstractions combine well. There's a hard to quantify tokio scheduling overhead visible in uv. Still, uv is using a mixture of regular futures on tokio, spawn_blocking for CPU intensive work to use the tokio threadpool, a subprocess pool of python subprocesses for bytecode compilation and rayon for parallel unzipping and installation.
There's also a lot of file locking and atomic moves involved to ensure that uv processes running in parallel can't break another.
On the upside, concurrency is key to uv's performance. We can simulate a single-threaded uv with mostly serial network requests by setting the concurrency limits for network, builds and installs to 1 each15.
TODO: Benchmarks of concurrency 1
Prefetching
Unreliable network
Some environments, such as github actions have (as of writing) unreliable networking. If a download fails mid-request, which it does a noticeable number, uv has to start the download anew as it can't resume downloads (another slowness), or because the request wasn't streaming (only for small requests though, where this matters less). Similarly, if a server replies if intermittent 4xx or 5xx codes, we have to retry and/or wait for the server to recover.
Lack of batch refresh
If you uv pip install …, uv caches (for pypi) all responses for 10min, following pypi's caching headers, then it has to revalidate. But there's no endpoint to ask whether all packages are fresh, uv needs to send n revalidation requests for n packages. Those ideally all return 304 not modified, but if n is larger than the network parallelism (50 by default), it takes a multiple of the roundtrip time. This applies similarly to uv lock/uv lock with --upgrade or uv add.
Forking
Platform markers in Python allow
TODO: Forking is kinda wasteful, because we clone and rebuild structures, only helped by preferences.
It's also not the most efficient inside uv, while most forks reuse the solution of the previous fork through version preferences, each fork clones the entire resolver state.
Fat wheels
Some wheels need different compiled artifacts for platform differences that can't be expressed in wheel tags. Numpy functions get compiled for different sets of CPU extensions, introduced in different cpu generations, which are merged into one big binary and with runtime dispatch (NEP 38, living docs). Torch similarly compiles its nvidia gpu code for a number of gpu architectures (streaming multiprocessor architecture, not cuda) and merges all of them into a binary that's somewhere between 100MB and 2GB. This is hugely wasteful, as there's no support for selecting only specific wheel variants yet. Projects without the resources of numpy or torch generally build against the oldest supported hardware only (at least for pypi), so uv installs code that's slower than necessary at runtime (or worse, fails on old machines).
System and abi dependencies
Some packages, such as psycopg2, mysqlclient, flash-attn, a number of scientific packages and a number of hardware integrations, don't ship wheels because they depend on system headers or on the specific version of an already installed library. The most popular packages now ~all ship wheels, but the remaining non-wheel packages are a noted pain for many users, both for performance and for setting up the build environment outside uv.
Allocating memory
uv puts a lot of effort in uv to avoid unnecessary allocations, such as passing around references as default, using Box to constrain type sizes, using Arc for shared references, using Cow to only allocate if an object was changed and using small string optimizations 16,17.
Contrary to its reputation, rust doesn't default to being good about memory usage and allocations. A modern GC does a lot to offset allocations, and bakes optimizations into the language, and avoiding clones requires ceremony throughout the code. In python as counterexample, all objects are reference counted, while Rust requires changing the type to Arc throughout. Python has a free list of objects that gets reused, and java features a generational garbage collector to deal with short-lived and long-lived objects, while in rust you need to build or bring your own arena. Some types, such as Dist, could also be smaller. In rust, all objects include their children directly by default (not references), and enums have the size of their largest variant recursively. This requires well-placed Box types to keep type sizes in check, including for error types (which determine the size of the entire return type) and for futures. What rust does provide is precise control over allocations and memory layout, allowing to pick the optimal bytes in critical paths. uv for example has assertions about type sizes in critical locations.
Rust uses the system allocator by default, which slow, on musl doubly so than on glibc, so uv has to switch to jemalloc and mimalloc. I bet an allocator optimized for Rust instead of C/C++ usage patterns would be a speedup.
A location where uv isn't optimized much yet is memory. For example, uv takes 110MB just to say that the lockfile is fresh, with a total of 10.7 GB and 8.8 million allocations for a warm cache uv run in airflow:
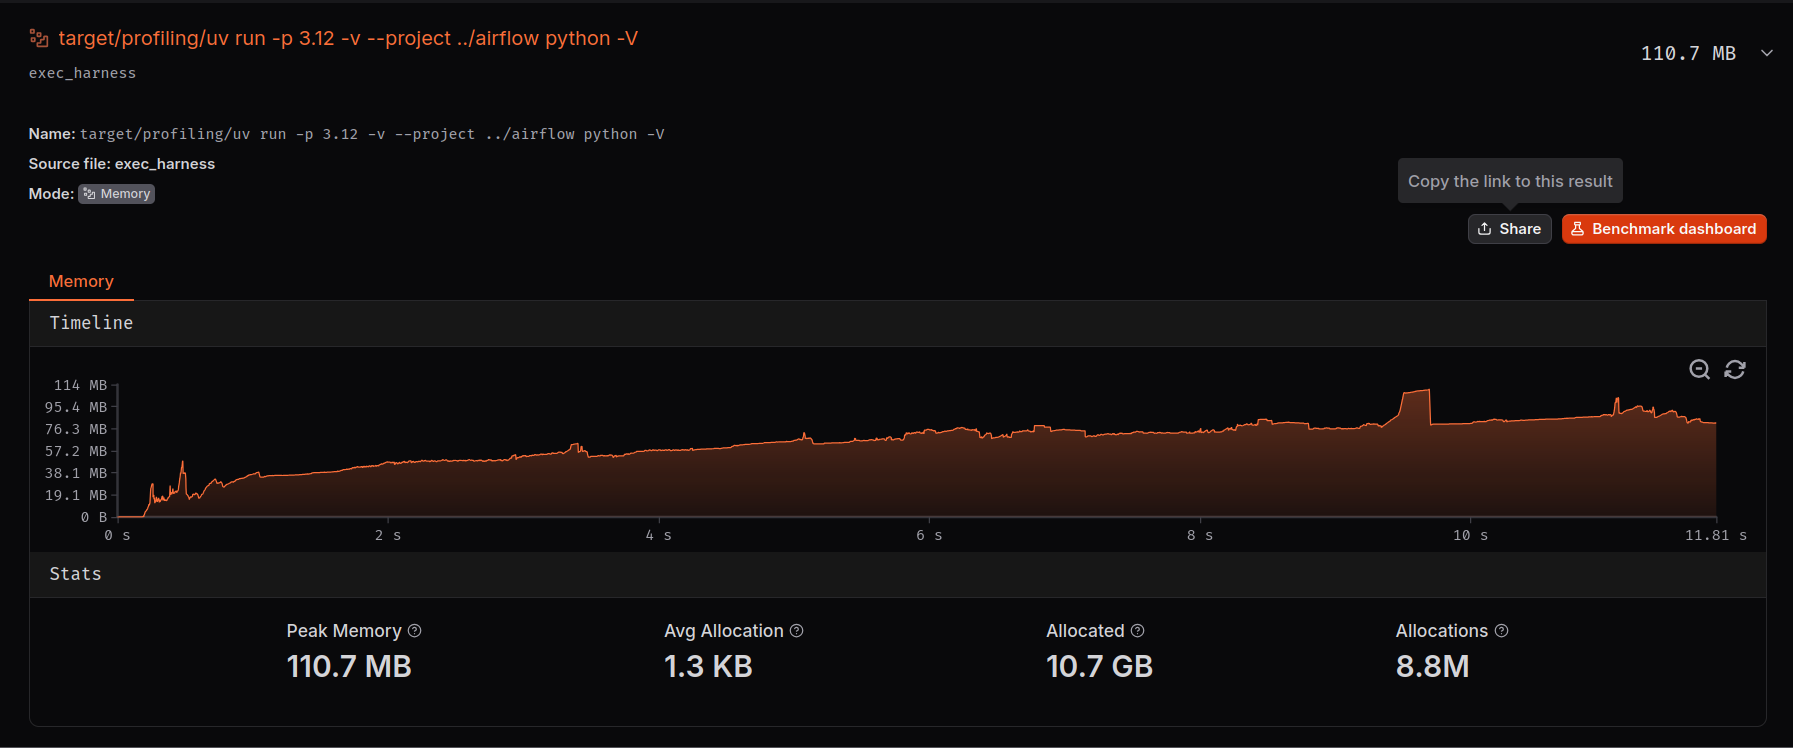
Figure: A local codspeed memory profiler run for warm cache uv run with the full results linked.
On the flipside, the reports about OOM errors we could confirm were caused by source distribution builds, not by uv itself.
Freeing memory
Rust uses the Drop trait to recursively free datastructures and to run pre-free hooks, such as refcount decreases. To deallocate an object or a collection, drop() on the object or collection first needs to call drop() on all of its members. This can be noticeable, for example when having a large number of Arc'd versions where each drop is an atomic refcount decrease and check if the count is zero to deallocate the object it wraps, especially combined with large datastructures such as the distributions and incompatibilities built up during a resolution.
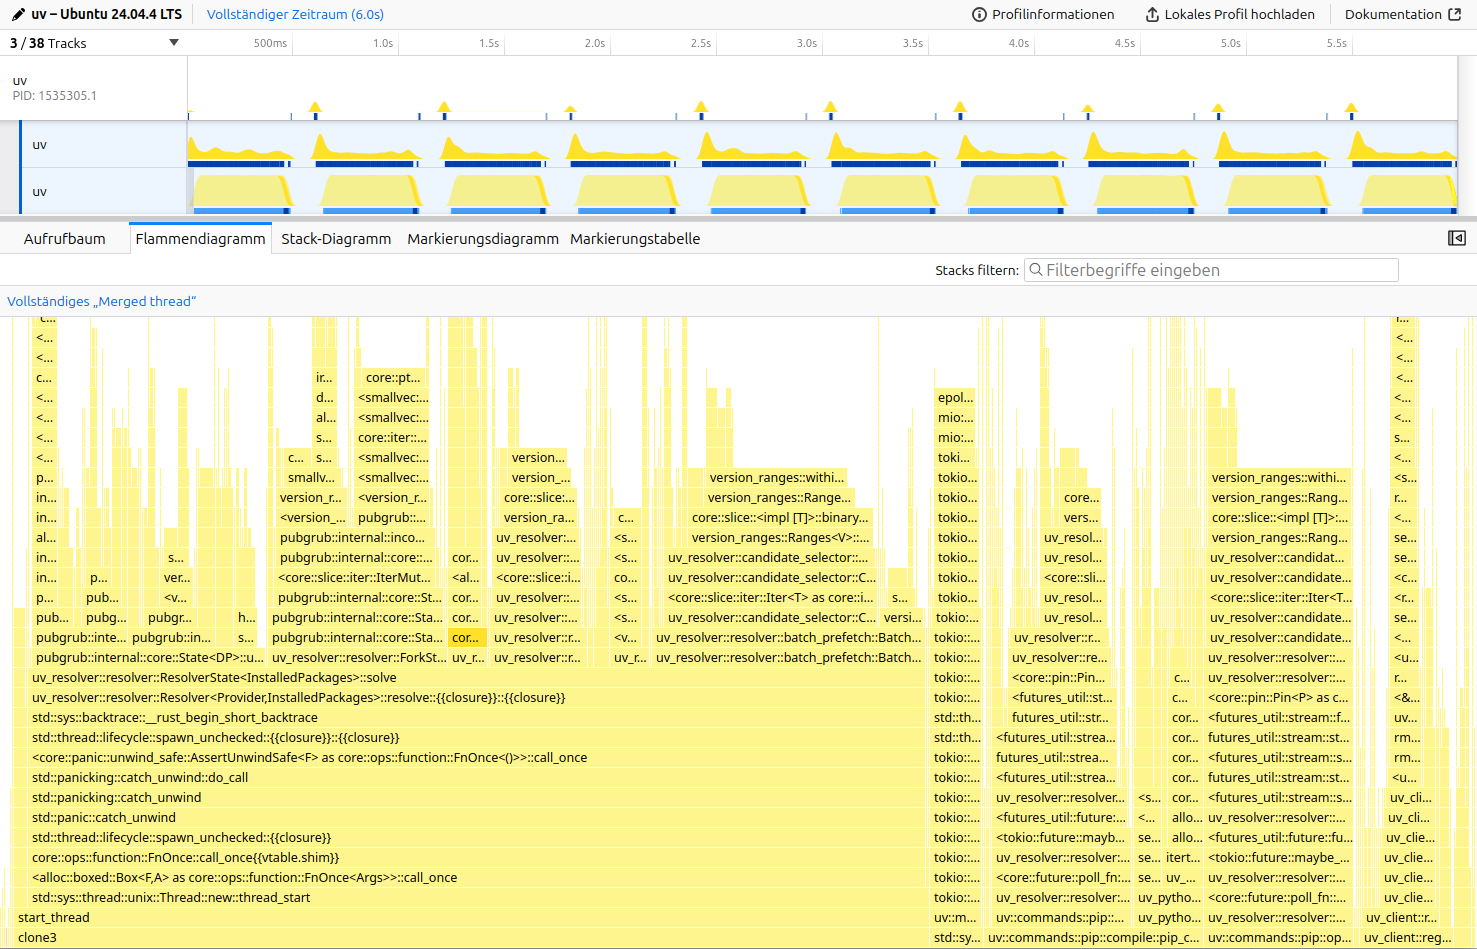
Figure: The samply profile for resolving urllib3<1.25.4 boto3 with uv pip compile (10x for better data). boto3 is a backtracking heavy benchmark, that builds up a large database of incompatibilities in the resolver. The highlighted block is a recursive drop after a successful resolution.
Command: samply record --rate 5000 --iteration-count 10 --reuse-threads ./uv-main pip compile boto3.in.
Tooling
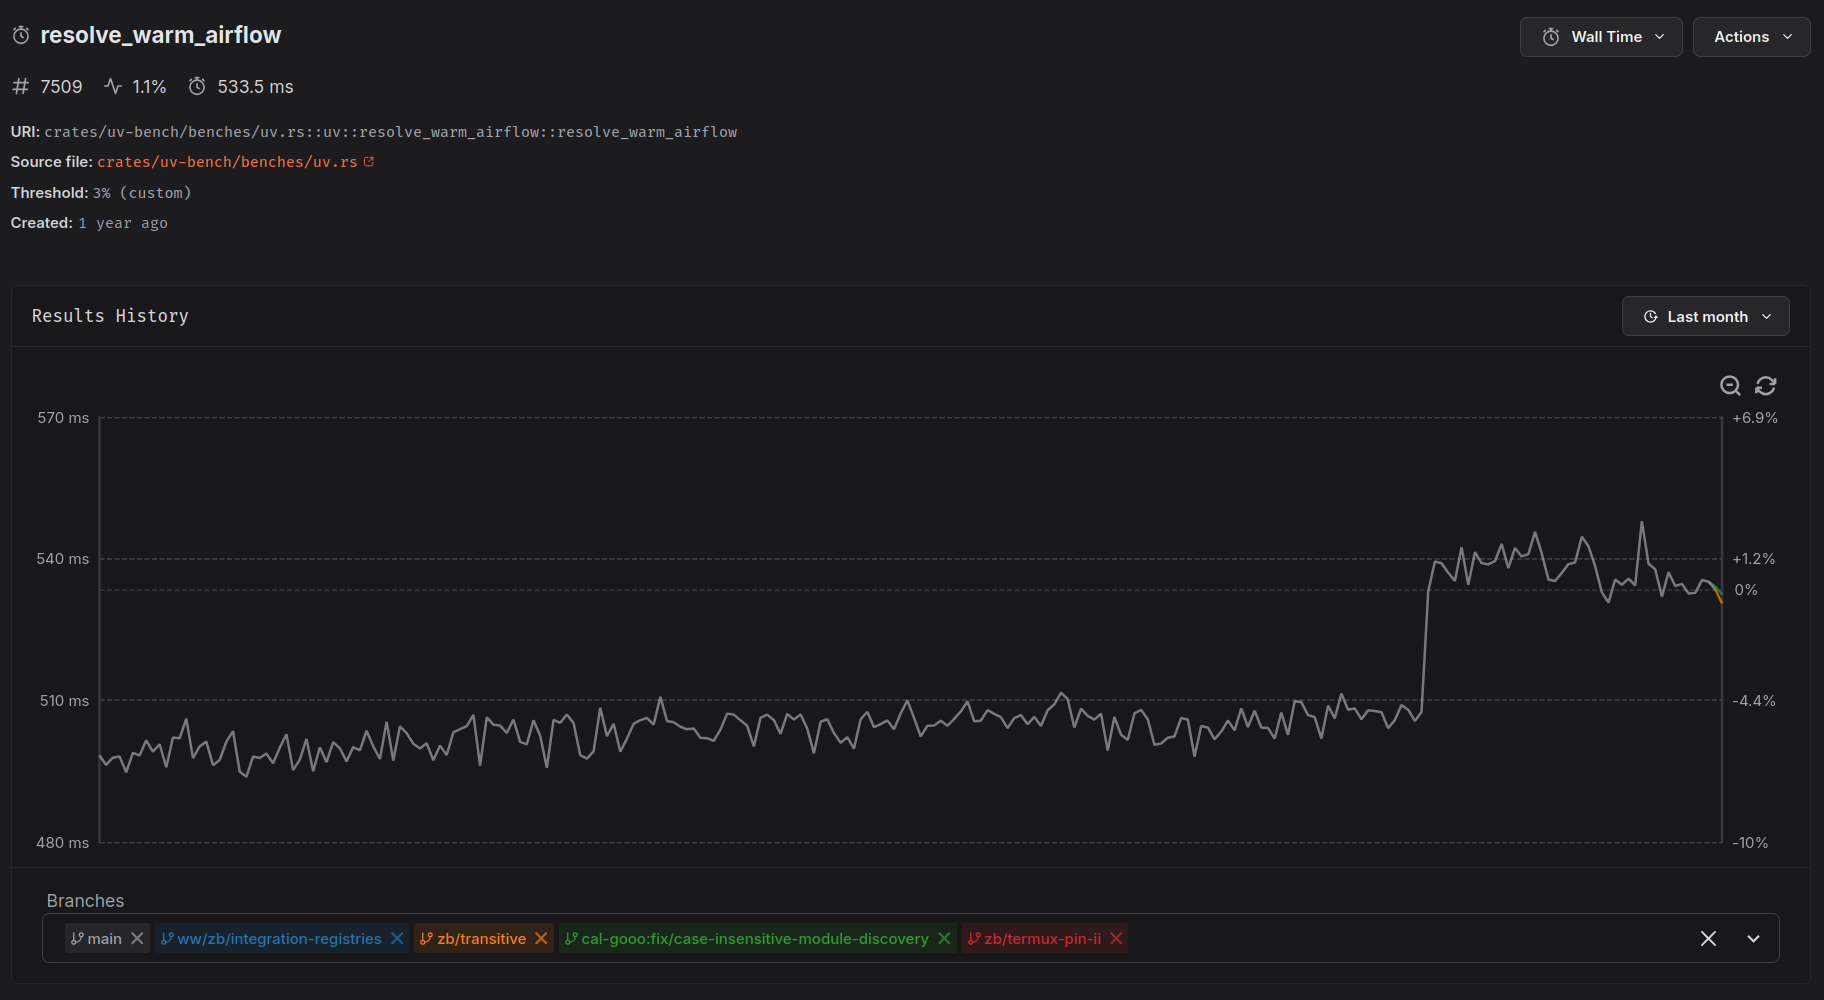
This isn't a performance problem, this section is about all the great tools that make these investigations possible. citerion is our benchmark harness and CodSpeed provides our continuous benchmarking. I want to shout them out for being great with feedback an implementing a lot of features we need and often fixing problem same-day. Their web interface even has a flamegraph diff tool18. Below, you can see a small regression from a correctness fix we merged:
For local profiling, i use samply, which uses the firefox profiler UI, and for benchmarking, i use hyperfine, which very helpfully includes standard errors, so you can tell what's below the noise threshold and what's real.
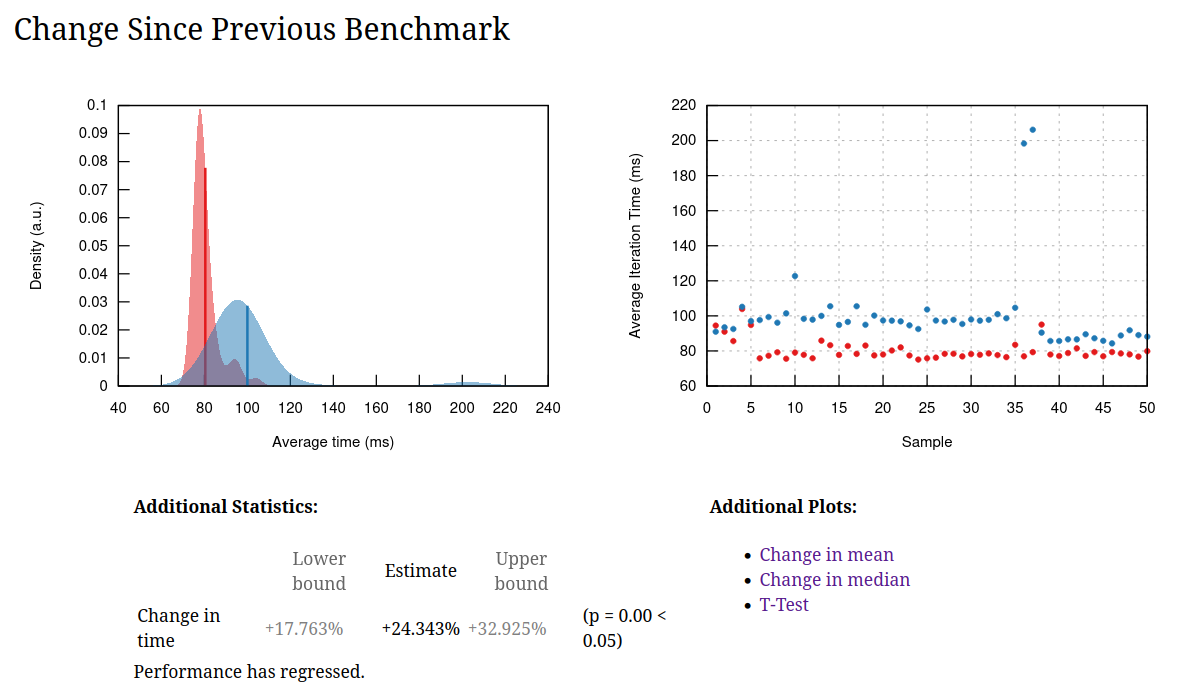
Figure: A criterion report from a noisy machine, causing the two outliers. Criterion features a t-test, which helps with telling if something is actually faster even for benchmarks with high variance. hyperfine can do t-tests through a separate script.
-
A mature library ecosystem is a requirement for adding a cpu-intensive operation to a packaging standard. For example, a (previous) blocker for zstandard was for example a missing std implementation. ↩
-
While uv is technically a SAT solver, the cases that exist are very specifically shaped, often driven by what earlier tools would support or struggle. It's important to pick realistic examples, rather than artificial or stress test benchmarks that do not represent real workloads. See also the talk Gotta Go Fast. ↩
-
NTFS is mysteriously slow for a lot of things, including uv's own test suit, but i've never found an explanation why. ↩
-
Bun was using a binary lockfile for maximum performance, but migrated to a text-based format as a binary file is tricky to review, merge conflicts are hard to resolve and tooling can't easily read it. ↩
-
The toml and toml_edit crates are optimized on features, such as preserving spans on parsing for excellent error messages and style-and comment-preserving rewrites on files. It's just not a performance audience, most people aren't bound by parsing configuration files. We use both its great error messages for configuration errors and its rewriting features editing commands such as
uv add,uv removeanduv version. ↩ -
Benchmarked as of airflow
7fa400745ac7aebc7cc4ec21d3a047e9fb258310on Ubuntu 24.04. You can get some reproducibility with--exclude-newer 2026-03-15, but as new distributions are published, the size of the server responses increases, which slightly changes the numbers. For scale, the warm cache boto3 benchmark that takes 420ms on my desktop machine and 3s on a raspberry pi 4b. ↩ -
As a general note, the numbers in this post aren't overly exact, and sometimes even show some divergence between different runs of the same benchmark. Due to the diverse kinds of resources uv uses (network (pypi, cloudflare CDN, github, other internal and external registries), disk, CPU (singlethreaded), CPU (multithreaded), CPU-accelerated code such as SHA-256, different concurrency frameworks), bottlenecks vary. It doesn't make too much sense to optimize for getting exact low noise numbers on a specific machine. When developing speedups, we focus on determining if something is speedup beyond the noise threshold (there's enough of them that we usually that we don't need more sensitive benchmarking) or if there's another indicator for optimization, for example a flamegraph. The numbers here are for giving a sense of scale. For example, the profiling build i use for benchmarking (
cargo build --profile profiling --features tracing-durations-exportis 12% slower than a regular release build (cargo build --release). There's some tricks to reduce noise for low-percentage performance optimizations, such as ensuring a quiet machine, setting the CPU governor to performance and usingtasksetto pin the benchmark to performance cores, but they may not even be realistic when users aren't setting these options in practice. ↩ -
In rust, enum variants can have different members. In python terms, this would be a version protocol with the small and the large representation as classes implementing it. What Are Sum, Product, and Pi Types? is a great introduction. ↩
-
It should really just be 8 bytes and leaving a bit for the enum discriminant, another thing that makes uv slow: https://github.com/astral-sh/uv/blob/7cd6738def40106b1d0ac9eaefc233fcffedc9de/crates/uv-pep440/src/version.rs#L1144-L1154 ↩
-
If wheels could have dynamic metadata that changes depending on the host, it wouldn't be possible to build lockfiles, and it would require code to determine this on installation, which is a security and stability risk. Dynamic metadata here specifically means that you need to run code to get the real values, it does not refer to e.g. platform-specific dependencies, that the package manager can evaluate with its own (or vendored) code, since the description of the platform markers is a well-defined expression. ↩
-
There's some debate over whether all wheels of a release need to have the same metadata, and whether source distributions need to build into wheels of that same metadata. While it's not technically required in any spec yet, it is explictly required by both poetry and uv - both fail when this assumption is violated - and it is respected in the ecosystem. I'm only aware of two high-profile cases with old releases with tensorflow and torch which accidently shipped different metadata due to the complexity of their build systems. It's technically possible to work around wheels having different metadata, though it's unclear why this should be done, as on one hand platform markers exist precisely to have a single dependency specification for all platforms, and on the other, it would be a huge overhead in terms of network requests and resolver complexity. The other property is that source distributions are required to build into the same metadata as wheels (if any) or alternatively into the same metadata each time. This is required by every tools that uses lockfile: You can't install from a lockfile if a package has a new or mismatching dependency at install time that was never considered in the lock. Even pip behaves inconsistent when this property is violated. ↩
-
Index and registry are synonyms ↩
-
This prevents against attacks where the server that serves the file has been corrupted since the file was audited. It does not replace the part where you need to trust the author of the binary, but it makes this a one time trust, not a continuous trust that the infra is never taken over. ↩
-
Shout-out to Natalie Weizenbaum for developing pubgrub and writing about it, and to Matthieu Pizenberg and Jacob Finkelnman for writing and maintaining the pubgrub crate. ↩
-
This technically still allows concurrency between the resolver and a single network request as well as a single build, but it shows the effect sufficiently. ↩
-
See e.g. https://swatinem.de/blog/smallstring-opt/, https://mcyoung.xyz/2023/08/09/yarns/ and many more under the category "small string optimizations". ↩
-
Arguably, we lose a bunch of free performance and memory because
StringandPathBufare mutable by default, when we really needBox<str>andBox<Path>instead.StringandPathBufare three words (pointers) wide, and may over-allocate. We almost never modify string or paths in place, and definitely not in hot loops. We would likely also profit from defaulting to small string optimizations, most strings in uv are small-ish and i don't think we require the array-ness often if at all (OS APIs require conversions to C string or Windows datatypes anyway). ↩ -
They support instruction counting next to walltime benchmarks, which should give more accurate results especially in CI. For uv there was a too high number of spurious regressions, so we had to deactivate it. Writing this article, i think i figured out why: https://github.com/astral-sh/uv/pull/18487. Fingers crossed we get the instruction counting benchmark back as most reliable. ↩